
Part 1. to March 9th 2021 only
test
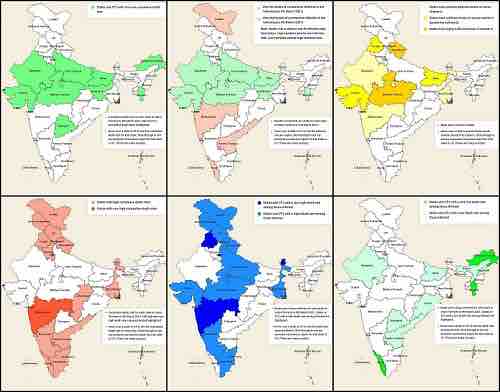
Map Index Page
Click on the maps to see infection rates, death rates among infected and cumulative mortality in Indian states and Union Territories. Hover and click through on a state or UT to see my report for that state or UT.
Disclaimer: Ivermectin works but vitamin d works better. You can’t take ivermectin forever but you can take 5,000 i.u.s of vitamin d forever. Side effects of vitamin d are greatly improved health and your diseases will go into remission or near to it. High dose vitamin c intravenous prevents the need for intensive care. See my bitchute video for more details.
The vaccine rollout disaster
A new spike in cases started in Maharastra, Goa and Delh in 2021. These were the worst hit states in India in 2020. No coincidence that they are also the states with the lowest mean serum level of vitamin d in citizens. 13 ng/ml, 19 ng/m, 15 ng/ml respectively. All severely deficient per Professor Holick. The new spike started at almost exactly the same time that vaccinations started and the rise in new cases mirrors exactly the rise in numbers of those vaccinated. Is there a connection? Is it because Indians became lax because of their end of year low infection rates, thought that the vaccination roll out would put an end to coronavirus and stopped drinking their kadha and eating their chyawanprash? Or could the vaccinations be causing the infections? Is this what Professor Cahill was warning about when she quoted this University of Texas 2012 study:
Immunization with SARS coronavirus vaccines leads to pulmonary immunopathology on challenge with the SARS virus – Tseng et al 2012
“…Conclusions: These SARS-CoV vaccines all induced antibody and protection against infection with SARS-CoV. However, challenge of mice given any of the vaccines led to occurrence of Th2-type immunopathology suggesting hypersensitivity to SARS-CoV components was induced. Caution in proceeding to application of a SARS-CoV vaccine in humans is indicated….”
Maharashtra and Delhi start new spikes in other states
From 15th April Maharastra started sending its migrant workers home to their home states again and this date coincides with new, small spikes in the states they were sent home to. I anticipate that these small spikes will peter out quickly in high vitamin d level, mainly agricultural states such as Bihar and Madya Pradesh as the returnees return to labour on farms in their home states & top up their vitamin d levels in the next few weeks. As you will see in my reports, the severely vitamin d deficient Uttar Pradesh (mean serum level 17 ng/ml) had the second lowest infection rate of all 36 states and UT’s. They are the only state in 2020 which used ivermectin. (I will let you read the report).
It’s a shame that the India government and state governments and Union Territories are letting themselves be intimidated by the WHO and the rest of the vaccine industry corrupted public health mafia institutions including the India Council of Medical Research in India on this subject. Goa started to use ivermectin when the second wave started in 2021 and then immediately caved and removed it from the kits they were distributing under pressure from the Indian Union ministry of health. I hope those responsible are able to sleep at night because they have blood on their hands!
By June 30th 2021 cases and deaths had plummeted again. This was not due to vaccinations but distribution of the ayurvedic answer to ivermectin: “Ayush 64”.
Click on a state or UT to see my report and conclusions
Click on a state in one of the maps to see the mean serum vitamin d level, coronavirus dashboards of infection rates, death rates among infected, cumulative death rate, and a summary of ayurvedic and other medical interventions in the state in question and how all these things affected infection rates, mortality rates etc. in my comments at the end of each report.
Note: it takes me a day to check all the links and statistics in each report for accuracy, sometimes do more research and write up my comments. States from J for Jarkhand to W for West Bengal, apart from Punjab and Rajasthan, do not yet have full comments, only a “generic comment”. Mean vitamin d levels and other statistics in those reports have not yet been fully checked for accuracy (links are given if you want to check them). I hope to do full reports for them within the next two weeks.
Click Map 1. 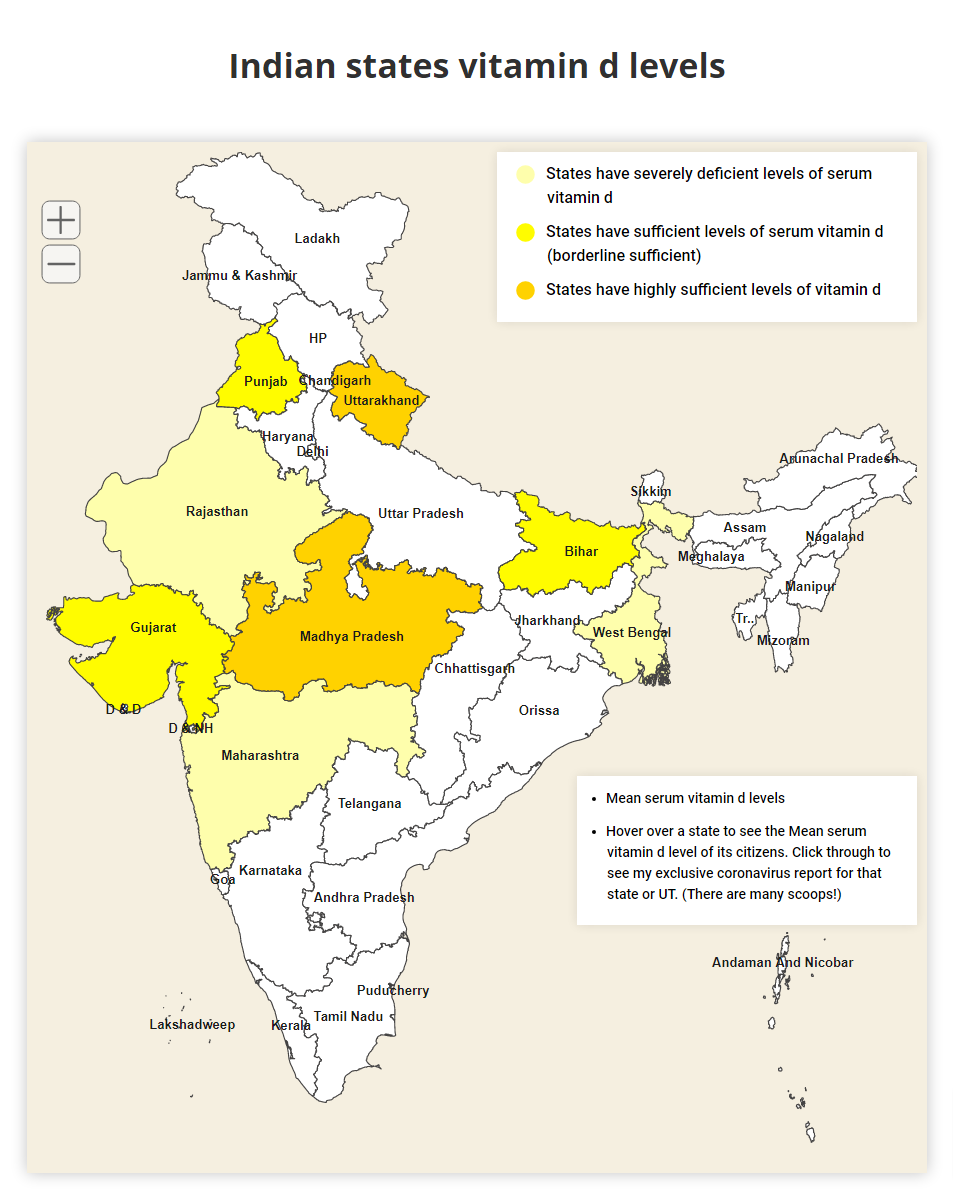 Mean serum vitamin d levels in each state or Union Territory in ng/ml (per Padhi et al))“..Most experts agree that 25(OH)D of more than 20 ng/ml is considered to be vitamin D deficiency whereas a 25(OH)D of 21-29 ng/ml is considered to be insufficient. The goal should be to maintain both children and adults at a level of more than 30 ng/ml to take full advantage of all the health benefits that vitamin D provides…” (Holick).
Comment on mean serum vitamin d levels in states: Only 4 states have vitamin d sufficiency. 3 are borderline sufficient. Madya Pradesh with a mean serum level of 37 ng/m is the only highly sufficient state which is reflected in its results. For a few we have no data. Maharashtra, Delhi and Goa, the 3 most severely hit by covid-19 are severely deficient with mean serum levels of 13ng/ml, 15 ng/ml and 19 ng/ml respectively. ) Goa does not have the complete “Hindu advantage” see the report for Goa.) The “Rajasthan miracle” is an outlier because severely vitamin d deficient with 15 ng/ml (climate too hot to go out in the sun) but low infection rate, low cumulative death rate and high survival rate in those infected. Click through to see the report on the Rajasthan miracle. Hover over a state or UT to see the mean serum vitamin d level. Click through to see my exclusive coronavirus report for each state or UT. There are many scoops. Read Chris’s comments at the end to see my speculation on what affected the infection rate.
Click Map 2. 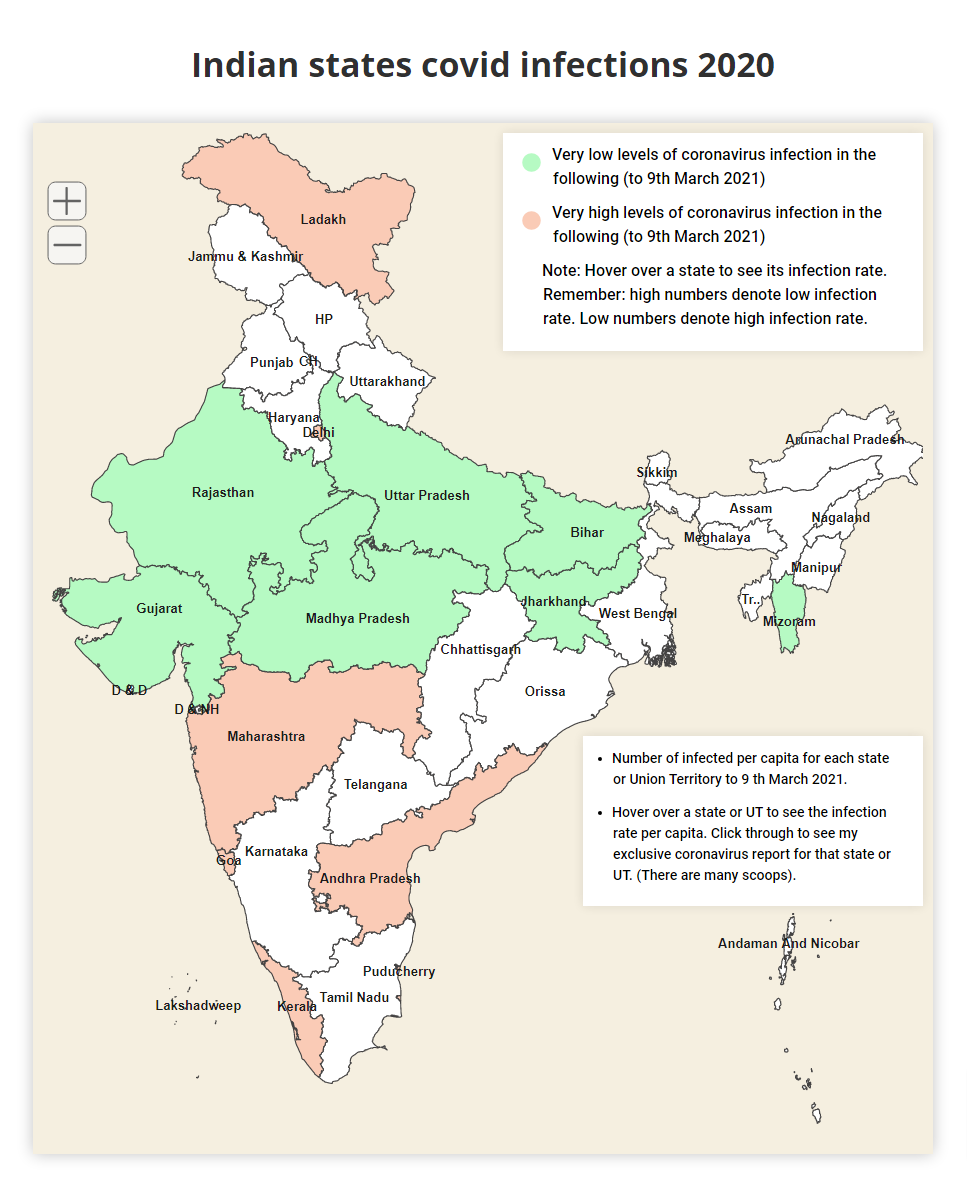 Number of infected until 9th March 2021 in each Indian state or Union Territory.States and UT’s with very low levels of infection are shaded green. States with very high levels are shaded in tan. Hover over a state or UT to see the infection rate. Shown as “1 in…..” Click through to see my comments in the report for the state or UT to see what affected the infection rate. In general the mean serum vitamin d level is the main factor. But not always. See the Rajasthan and Uttar Pradesh miracles.
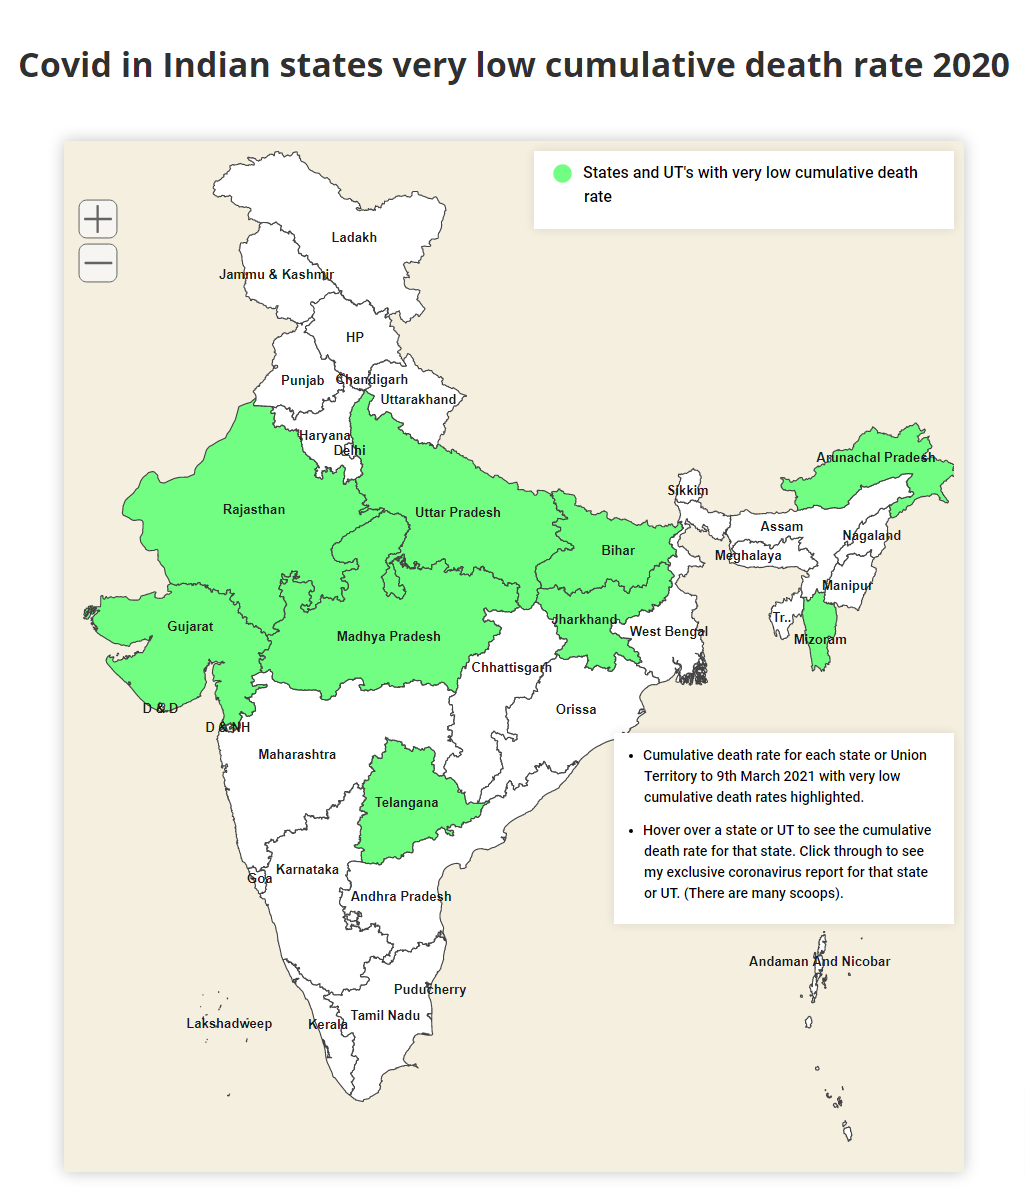 Click Map 3.b State and UT’s with very Low Cumulative death rate.
Given as “1 in …..” Remember: a low number indicates high cumulative death rate. Note that “high death rate” is a relative term because the UK has a cumulative death rate 3 times higher than Delhi, which has the worst cumulative death rate of all Indian states. States with very low death rates are shown in green.
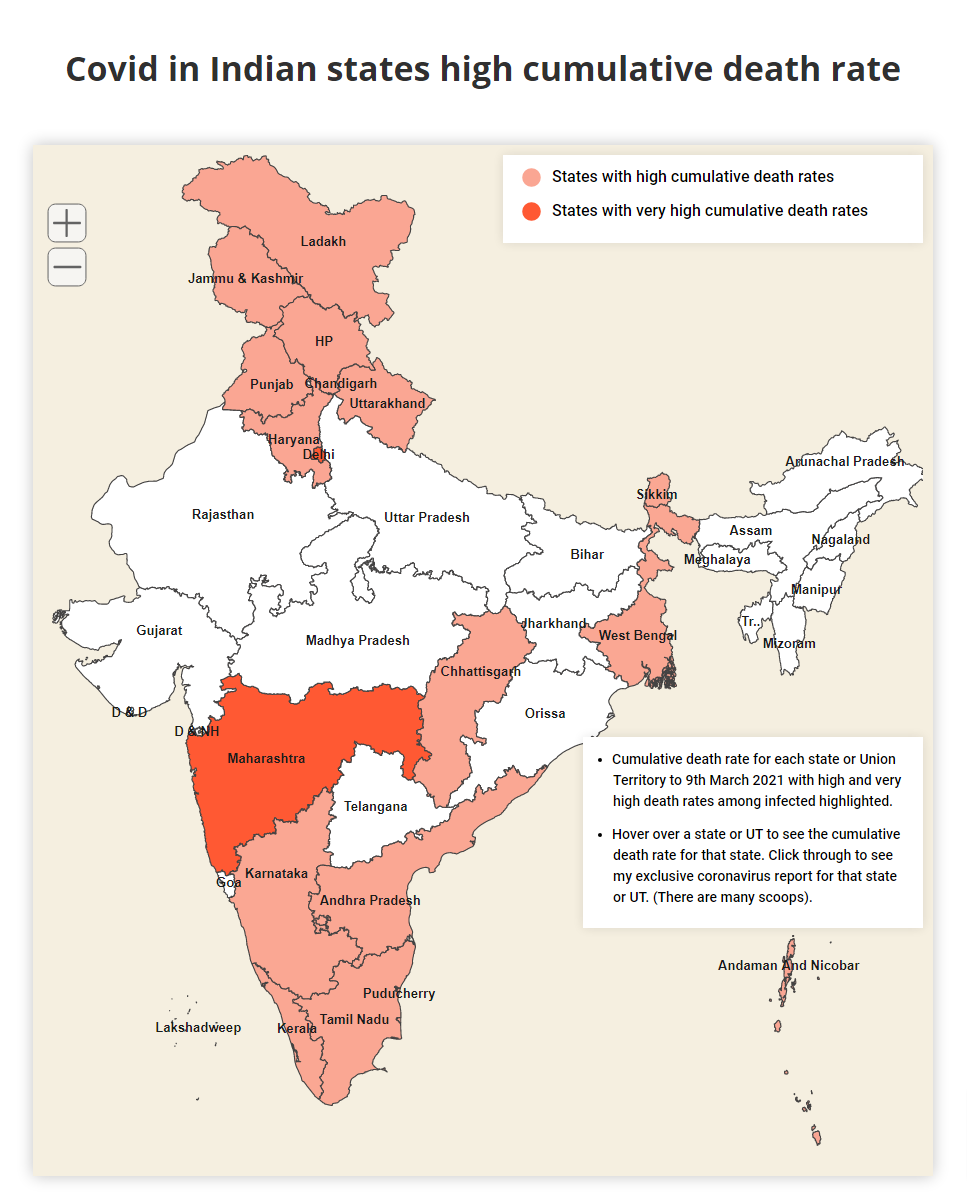 Click Map 3.a States and UT’s with high cumulative death rate.
Given as “1 in …..” Hover over a state or UT to see its statistic. Click through to read my report. Remember: a high number indicates low cumulative death rate. States and UT’s with high cumulative death rates are shaded tan. Very high cumulative death rates are shown in red.
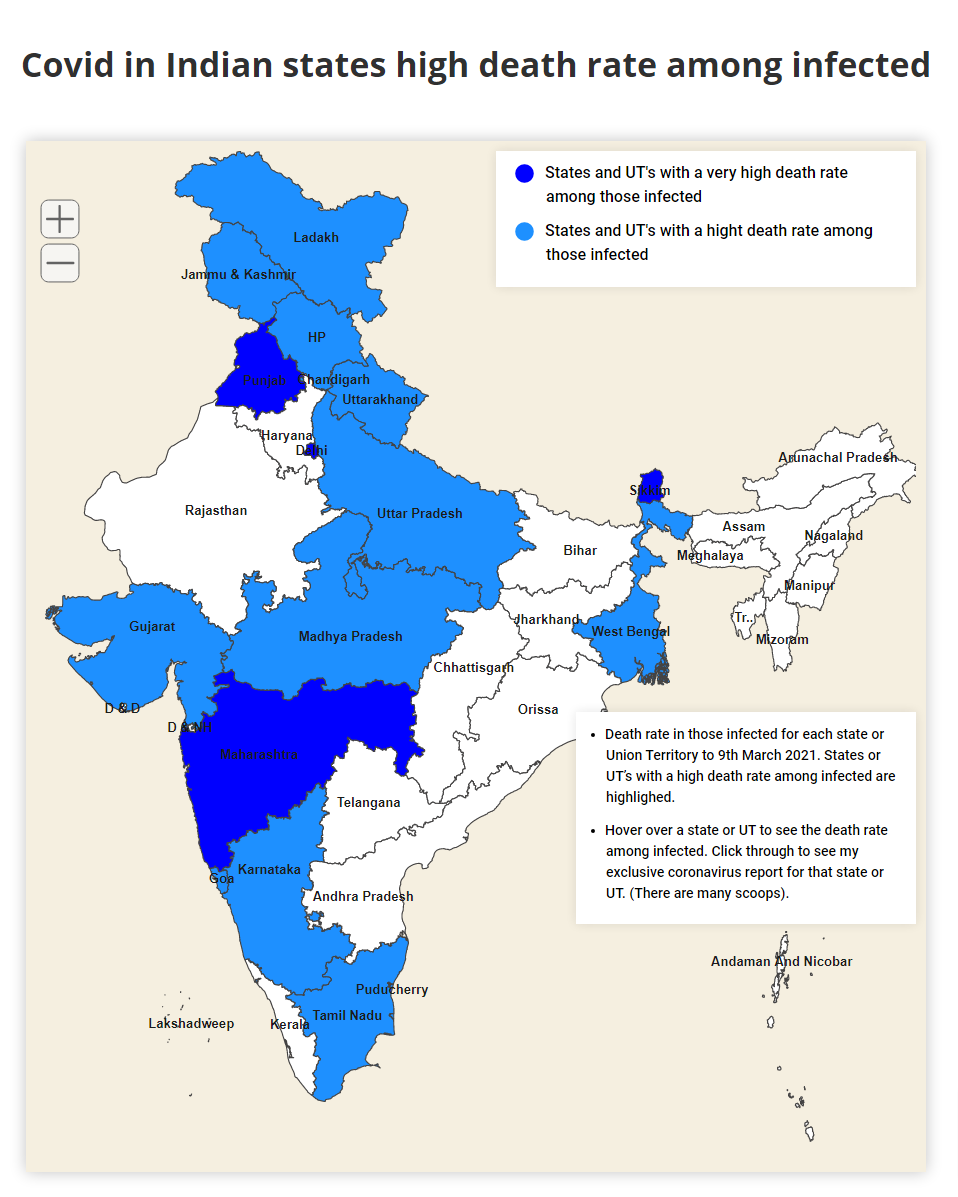 Click Map 4.a States and UT’s with high death rates among the infected
Death rate in those infected. Given as “1 in ….” Remember: a high number means low death rate. i.e. – high survival rate. States and Union Territories with a high death rate are shaded tan. Those with very high death rates are shaded red.
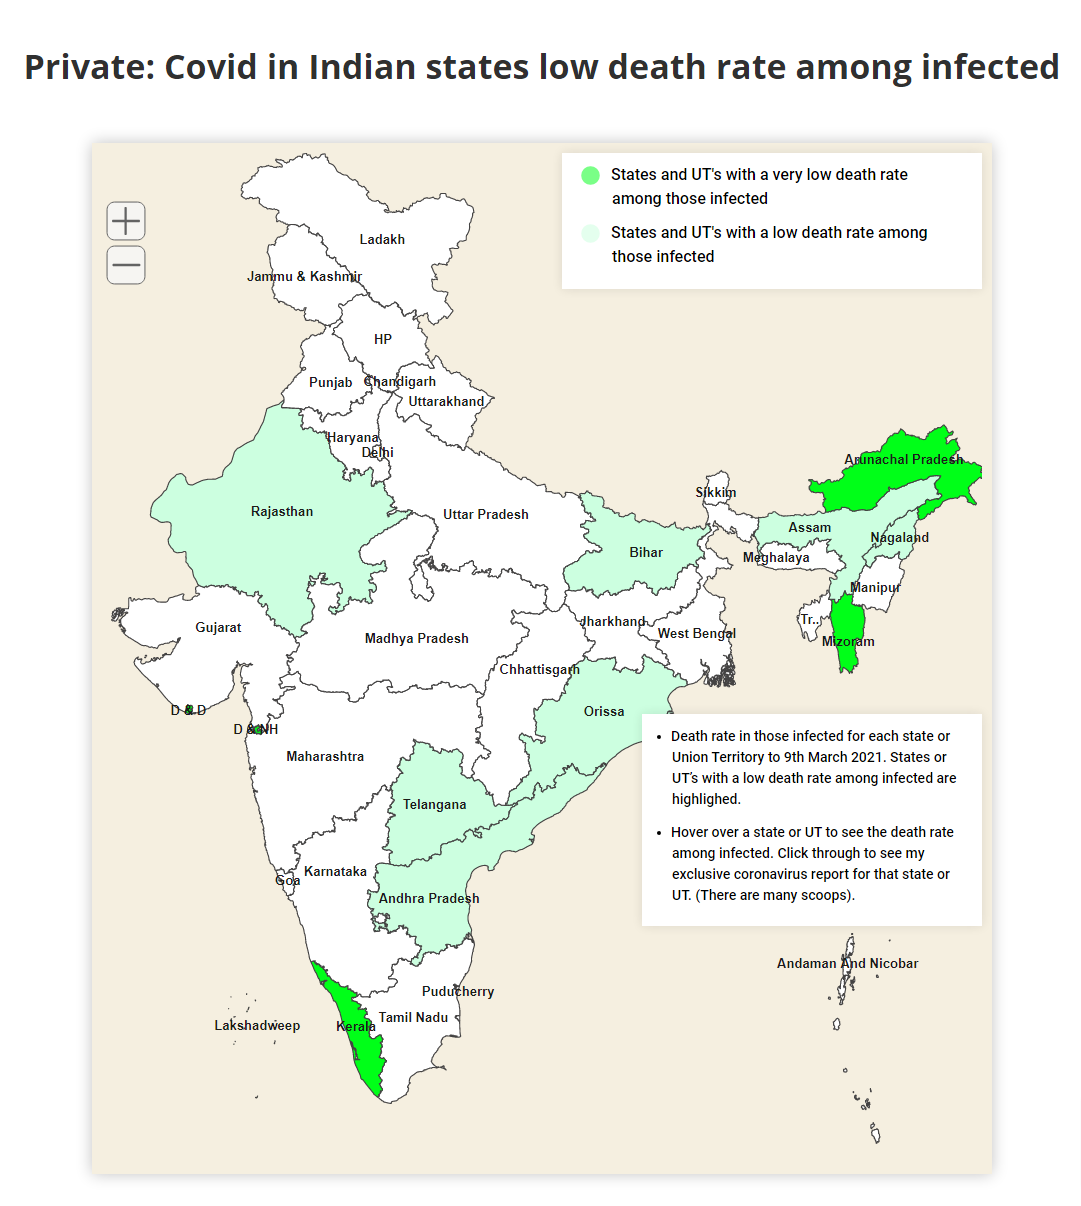 Click Map 4.b States and UT’s with low death rates among the infected
Given as “1 in ….” (So a high number means low death rate. i.e. – high survival rate). States and Union Territories with a very low death rate are shaded in bright, lime green. Those with a low death rate are shaded in pastel green.
Notes:
- The 8 Union Territories are governed by the central, union government with a UT administration.
- While those with mild and moderate infections were usually treated at home or in quarantine centres with ayurvedic medicine, the Union government gave instructions that only allopathic medicine could be used with severe cases.
- Outliers with very high survival rates among infected are Dadra & Nazar: 1 in 1,703(!) Lakshandweep: 1 in 510 (!) Mizoram: 1 in 433, Kerala: 1 in 250, Arunachal Pradesh: 1 in 301, Assam: 1 in 199, Telengana 1 in 183, Odisha: 1 in 172, Bihar: 1 in 170. Contrast these with the pitiful 1 in 34 in the UK. Hospitals in some of these states were using innovative therapies and getting these results. See my commentaries for each state.
- I know of 2 case studies where severe patients refused allopathic interventions and insisted on Ayurveda and a large trial of ayurvedic interventions in both moderate and severe cases. (See India main page and my commentary on this page). The cases where Ayurveda was used showed excellent results. If I ever have pneumonia get me an Ayurvedic doctor! Just kidding. Give me 30 grams of vitamin c intravenous over 24 hours in 4 divided doses and a one off vitamin d “hammer” of 60,000 i.u.s. If I’m not up and walking around in a couple of hours, up the dose to 50 grams of vitamin c per 24 hours, monitor my serum vitamin d level and keep giving me the vitamin d hammer every day until it’s 45 ng/ml.
Study
VITAMIN D STATUS: MEASUREMENT, INTERPRETATION AND CLINICAL APPLICATION
Holick 2009
“…Most experts agree that 25(OH)D of less than 20 ng/mL is considered to be vitamin D deficiency, whereas a 25(OH)D of 21-29 ng/mL is considered to be insufficient. The goal should be to maintain both children and adults at a level of more than 30 ng/mL to take full advantage of all the health benefits that vitamin D provides…”
![]()
 Copyright secured by Digiprove © 2021 Chris Parkinson
SUPPORT CHRIS
Copyright secured by Digiprove © 2021 Chris Parkinson
SUPPORT CHRIS